Elevation Profiles and Routes: How Data Can Predict Race Outcomes


Elevation Profiles and Routes: How Data Can Predict Race Outcomes
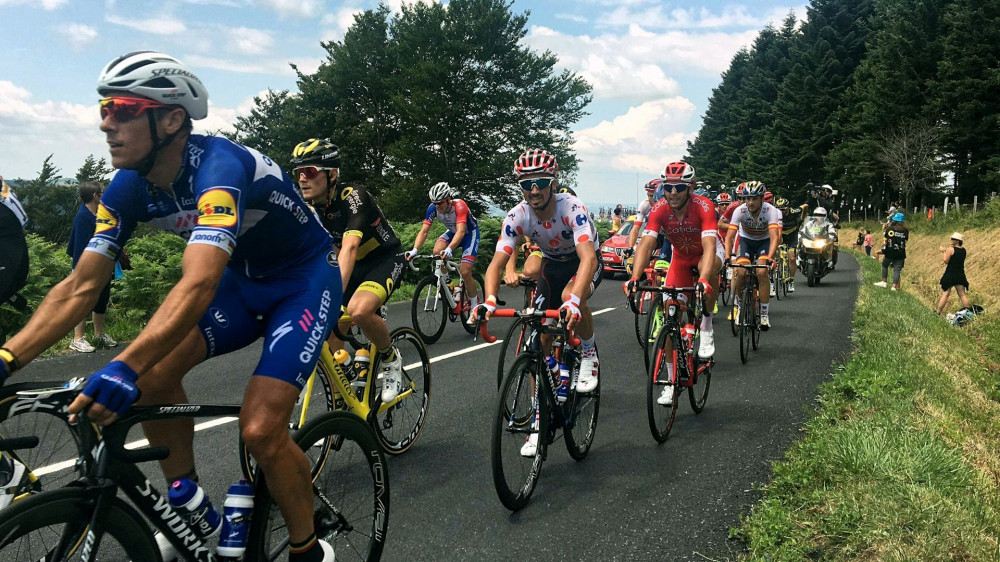
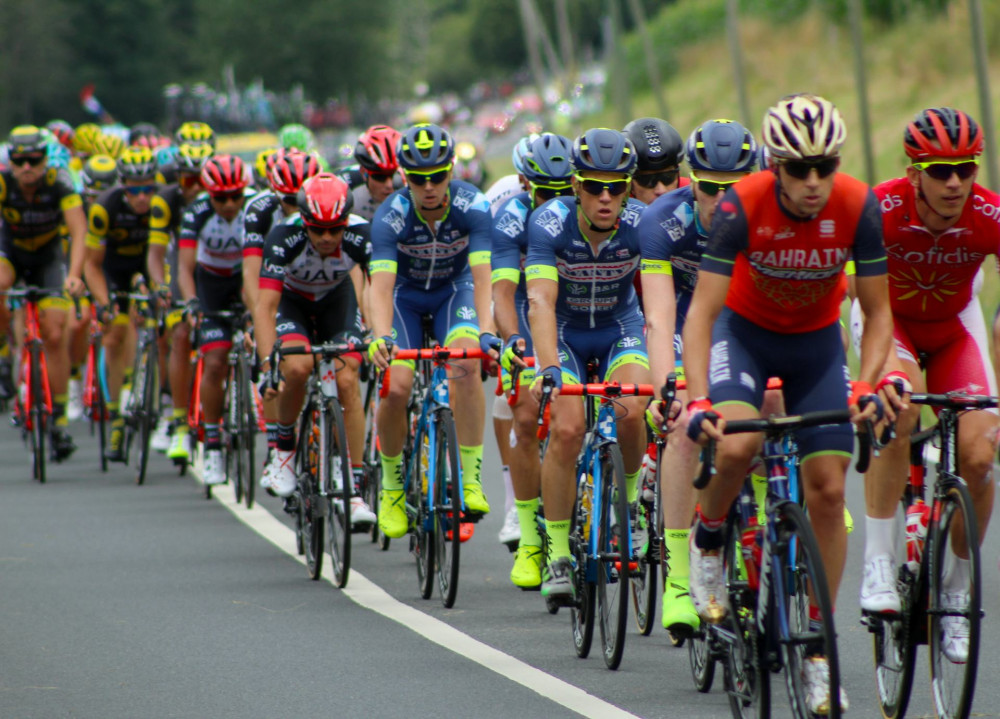
When the peloton winds its way through the Rockies, the Appalachians, or the rolling plains of the Midwest, it’s not just the riders’ fitness that determines who takes the win. Today, data plays an increasingly central role in predicting how a race will unfold—and who’s most likely to cross the finish line first. Elevation profiles, route analyses, and historical performance data give teams, analysts, and fans a data-driven window into the dynamics of a race.
The Elevation Profile – The Race’s DNA
An elevation profile is one of the most powerful tools for understanding a cycling race. It shows how much climbing the riders face, how steep the grades are, and where the flat sections lie. A route filled with short, punchy climbs favors explosive riders, while long, steady ascents tend to suit pure climbers.
By studying the elevation profile, analysts can predict where the race is likely to be decided. A tough climb near the finish often becomes the launchpad for attacks, while a flat final stretch usually points to a mass sprint. In American races like the Tour of California or the Colorado Classic, the profile often dictates whether the day belongs to the sprinters or the mountain specialists.
Data That Reveals Rider Strengths
Modern cycling teams collect vast amounts of data from power meters, heart rate monitors, and GPS devices. These numbers reveal how much power a rider can sustain on different types of terrain—and for how long.
By comparing riders’ performances on similar climbs or stages from past races, analysts can estimate who’s best suited for a given route. A rider who excels on 10-minute climbs at a 7% gradient, for example, becomes a prime contender when the course features that exact challenge. This kind of analysis helps teams tailor their strategies and helps fans understand why certain riders are favored on specific days.
Læs også:


Wind, Weather, and Positioning
Even the most detailed elevation profile doesn’t tell the whole story. Wind direction, temperature, and road conditions can dramatically alter how a race plays out. A strong crosswind on a flat stage can split the peloton and create unexpected winners, while rain on a technical descent can make even the favorites ride more cautiously.
That’s why teams integrate meteorological data into their race strategies. By combining weather forecasts with route information, they can predict where it pays to stay near the front—and where conserving energy might be the smarter move. In U.S. races, where conditions can shift quickly from desert heat to mountain chill, this kind of data-driven planning can make all the difference.
Historical Patterns and Probabilities
For those who follow cycling with an analytical eye—or even from a betting perspective—historical data is invaluable. By studying past editions of a race, analysts can identify patterns: How often does this type of stage end in a sprint? How many times has a breakaway succeeded on a similar route?
These patterns help calculate probabilities for different race scenarios. While no model can predict the exact winner, data allows for far more informed guesses than intuition alone. Over time, these insights reveal how certain race types tend to unfold—and which riders consistently thrive under specific conditions.
When Algorithms Take the Lead
More and more teams and analytics firms are turning to machine learning to forecast race outcomes. Algorithms are fed data on rider form, route profiles, weather conditions, and past results. From there, they generate probabilities for how the race might evolve—who will attack, where the peloton might split, and who has the best chance of winning.
Of course, no model can account for everything—crashes, punctures, or tactical surprises can always rewrite the script. But these predictive systems are getting better every year, offering an increasingly accurate picture of how a race is likely to unfold.
Data as a New Lens on Cycling
For fans, this data-driven approach adds a new layer of insight to the sport. Elevation profiles and route analyses make it easier to understand why a race develops the way it does—and why some riders seem to have “the perfect day” while others fade away.
Data can’t replace the drama, tactics, or human emotion that make cycling so captivating. But it can help us see the patterns behind the unpredictability—and maybe, just maybe, predict who will raise their arms in victory at the finish line.
Læs også: